1. Introduction
Radius variation plot graphics is used in most reports for stone symmetry indication:
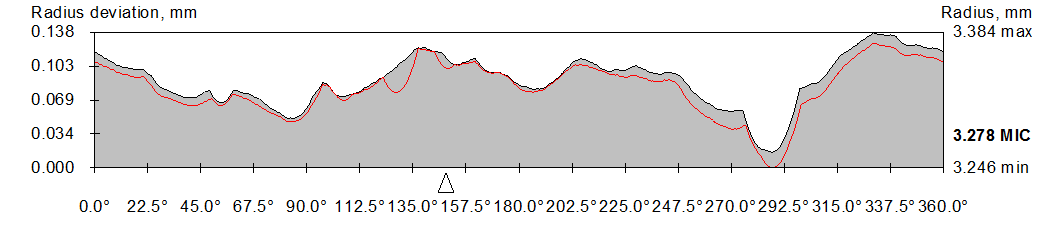
On X axis azimuth is shown.
On Y axis deviation is shown.
MIC is the radius of the maximum circle that may be inscribed.
2. Red curve line calculations
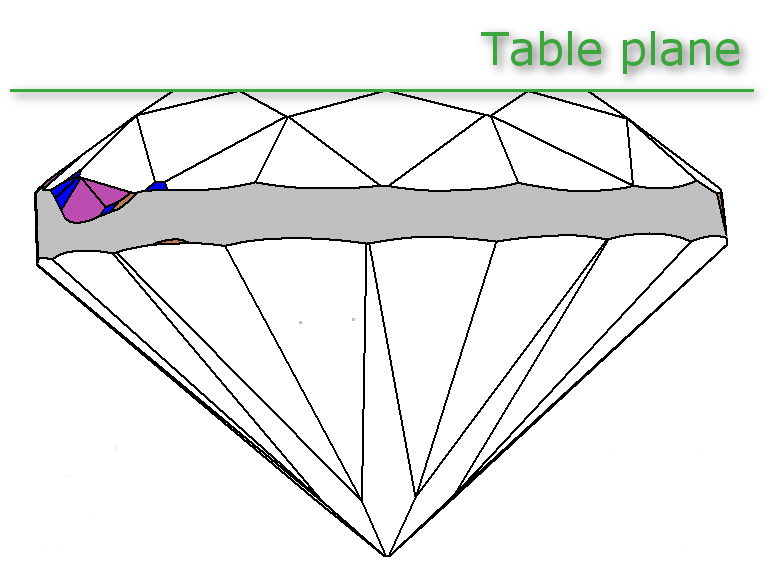
- Draw plane parallel to table plane through MIC center:
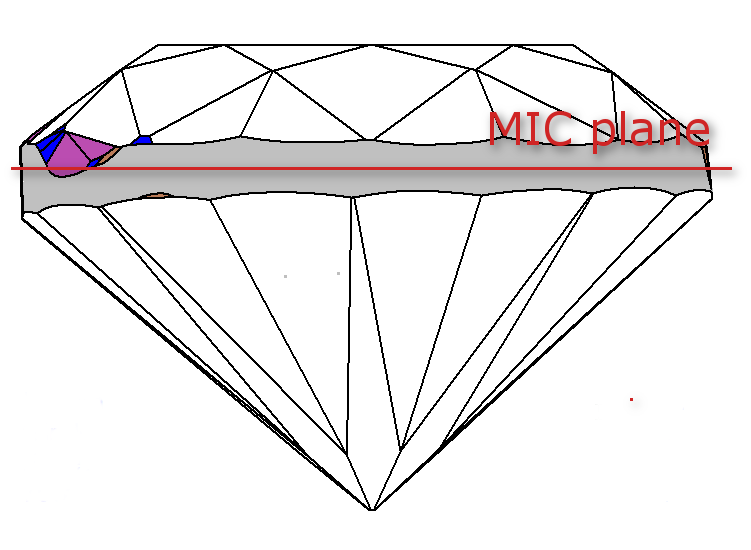
- In that plane distance from Girdle center mass to diamond out-line calculated for all azimuth.
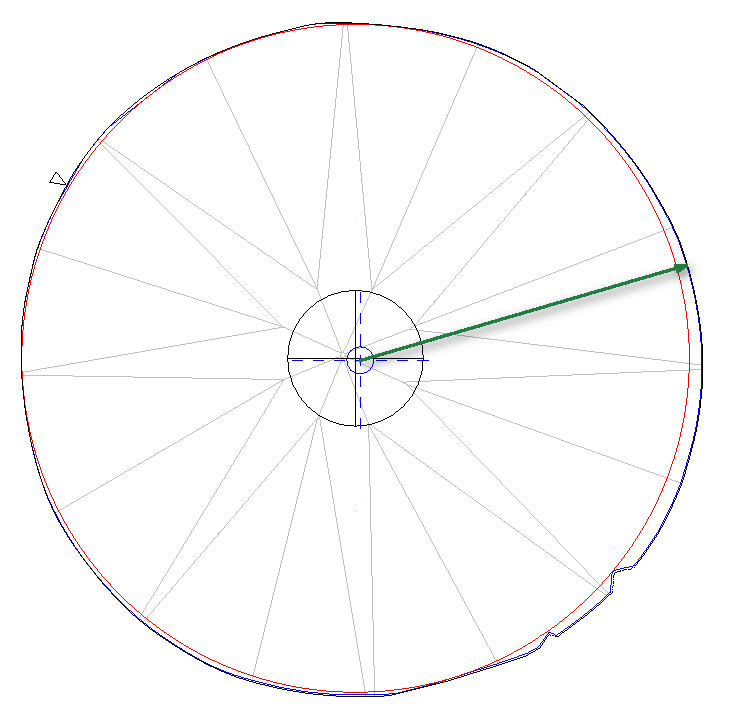
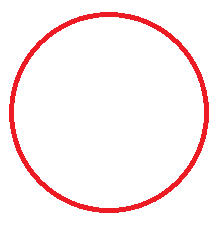
MIC is drawn in red color 
indicates MIC center 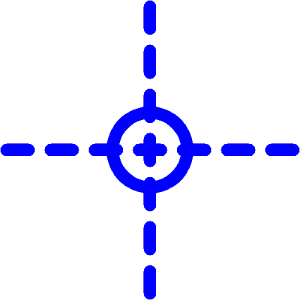
indicated Girdle center mass (model center) 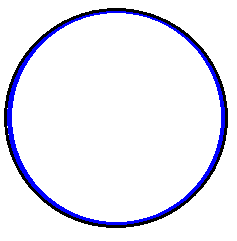
Diamond out-line is drown in blue color - Minimum radius from step 2 is selected.
- Graphics is drawn as deviation from minimum radius.
3. Black curve line calculations
- Model and Girdle center mass are projected on table plane:
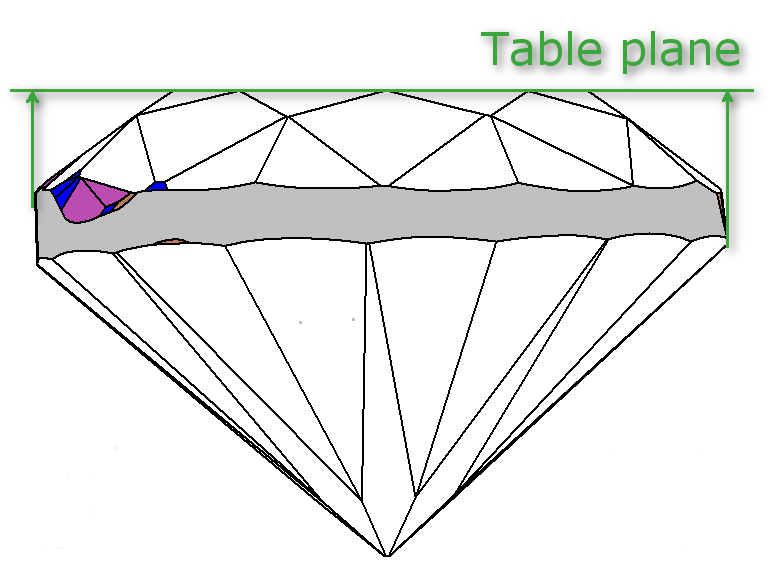
Distance from projected Girdle center mass to projection out-line calculated for all azimuth.
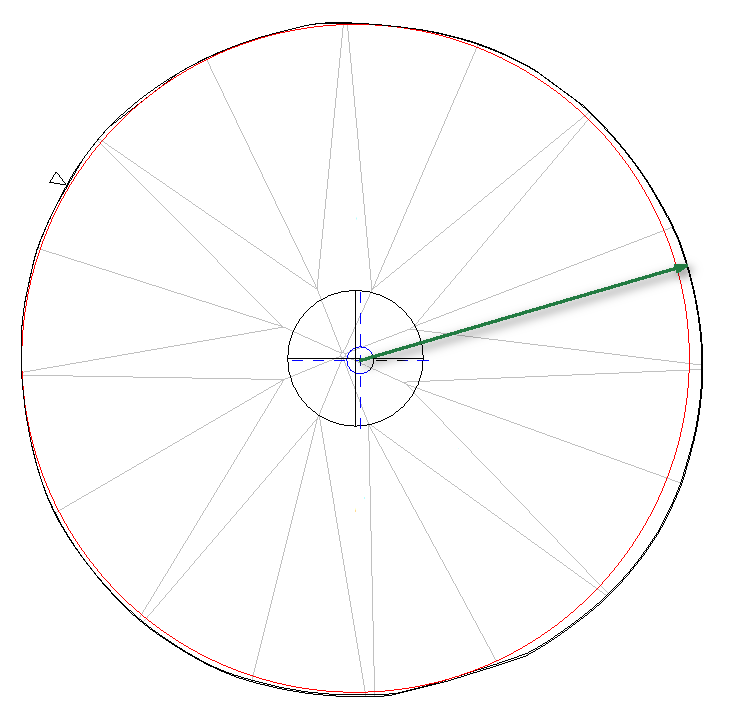
MIC is drawn in red color indicates MIC center indicated Girdle center mass (model center) 
Projection out-line is drown in black color Graphics is drawn as deviation from minimum radius from chapter 2 step 3
4. Notes
- If you have any question, please ask it in comments or send e-mail to developer.
- If you find mistake, please describe it in comments or send e-mail to developer.
- If you use report.dll 2.6.5.1 or later MIC center instead of Girdle center mass will be used for distance calculations as center.