OctoNus Stereo Viewer 4.4.0.33 and higher now offers instrument for quality audit of reconstructed 3D models (meshes). You can find this instrument after opening two 3D models in single view (layer) and than simultaneously select two layers in the similarly named panel.On figure below you can see in rectangle area №1 two selected layers, and in area №2 "Comparison 3D models" panel (see Figure 1).
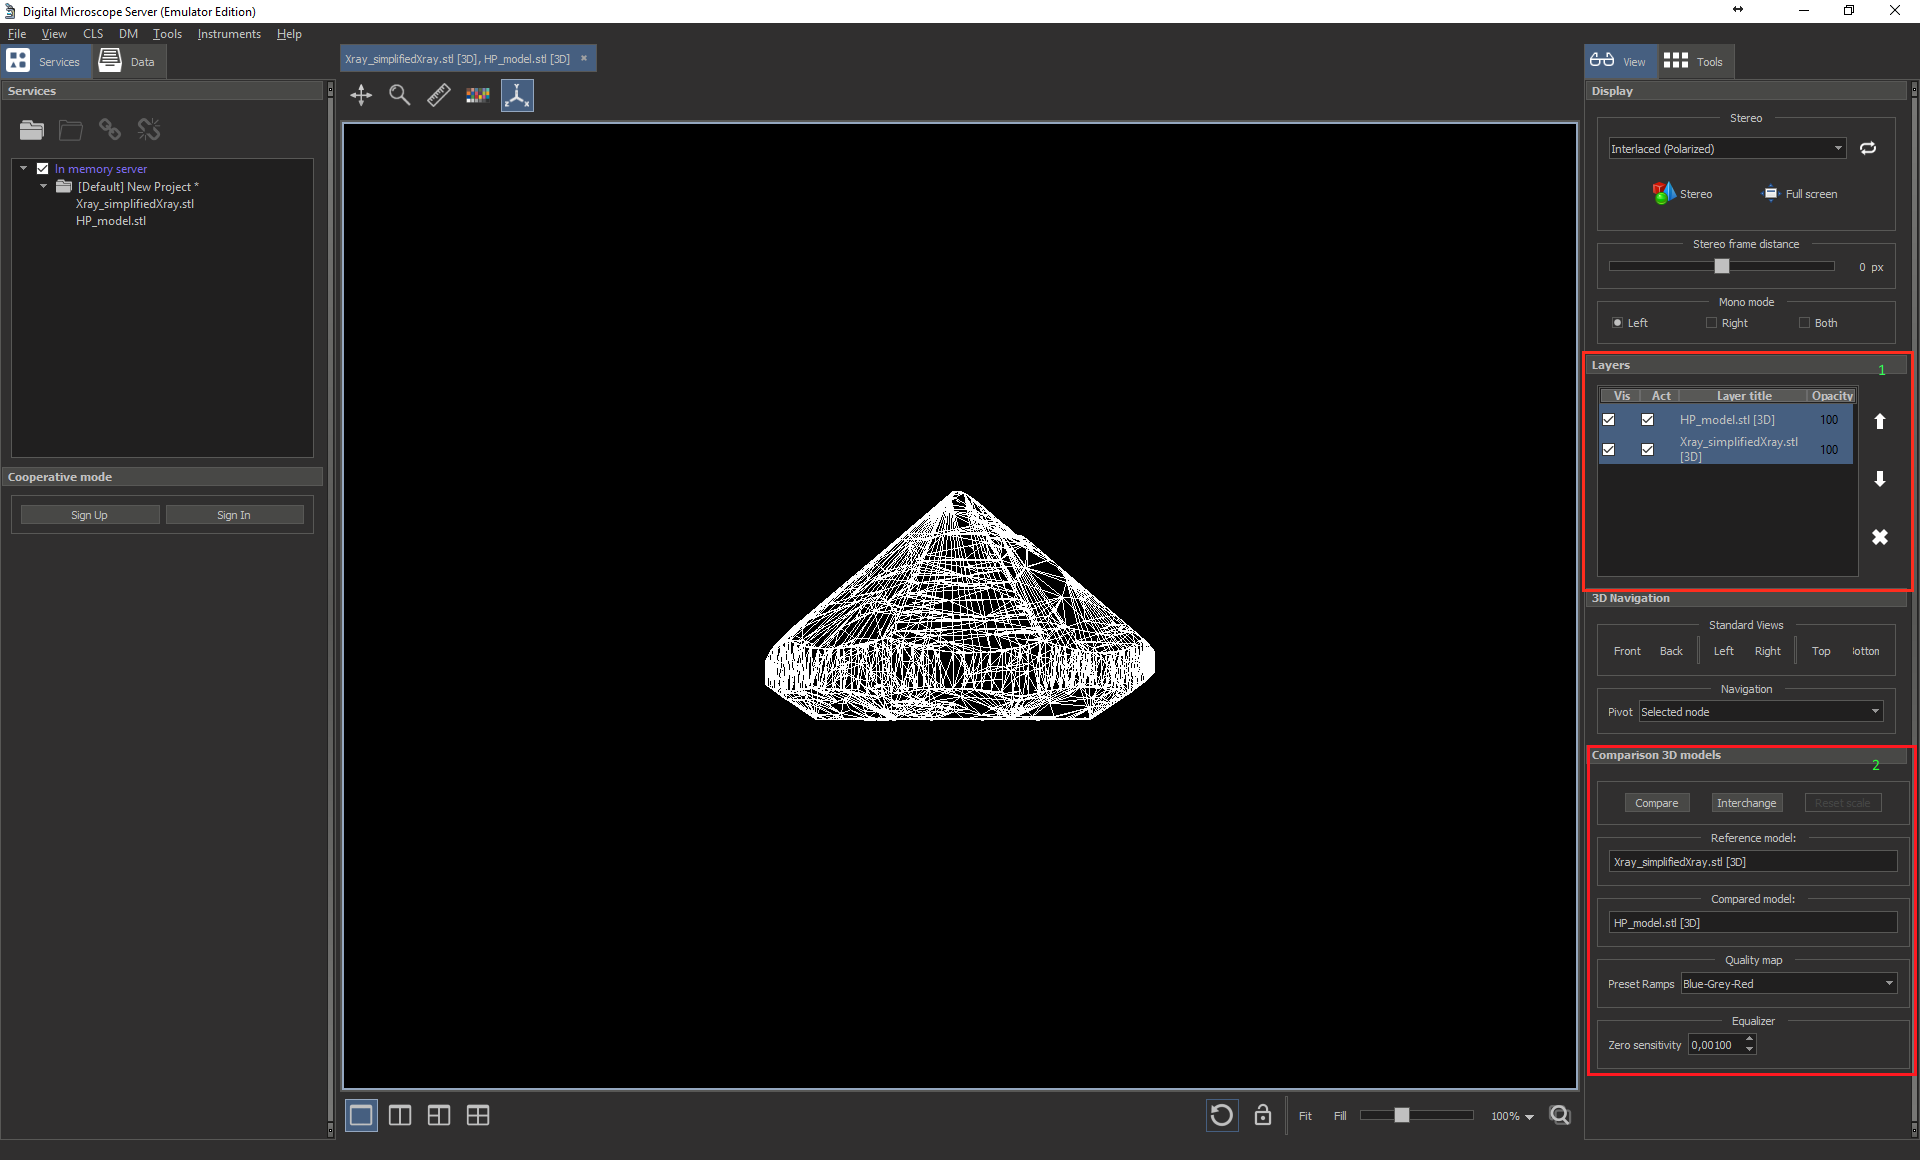
Figure 1. Active view with 2 selected layers
Models comparison
The comparison instrument computes the signed (per vertex) distance between a mesh and a reference mesh. In the box named "Compared model" there is the mesh that is measured, vertex by vertex, computing distance from the Reference model (mesh). You can change the compared model pressing the button "Interchange". To obtain the result of comparison you should press the button "Compare". On Figure 2 you can see main view with visualization of comparison result.
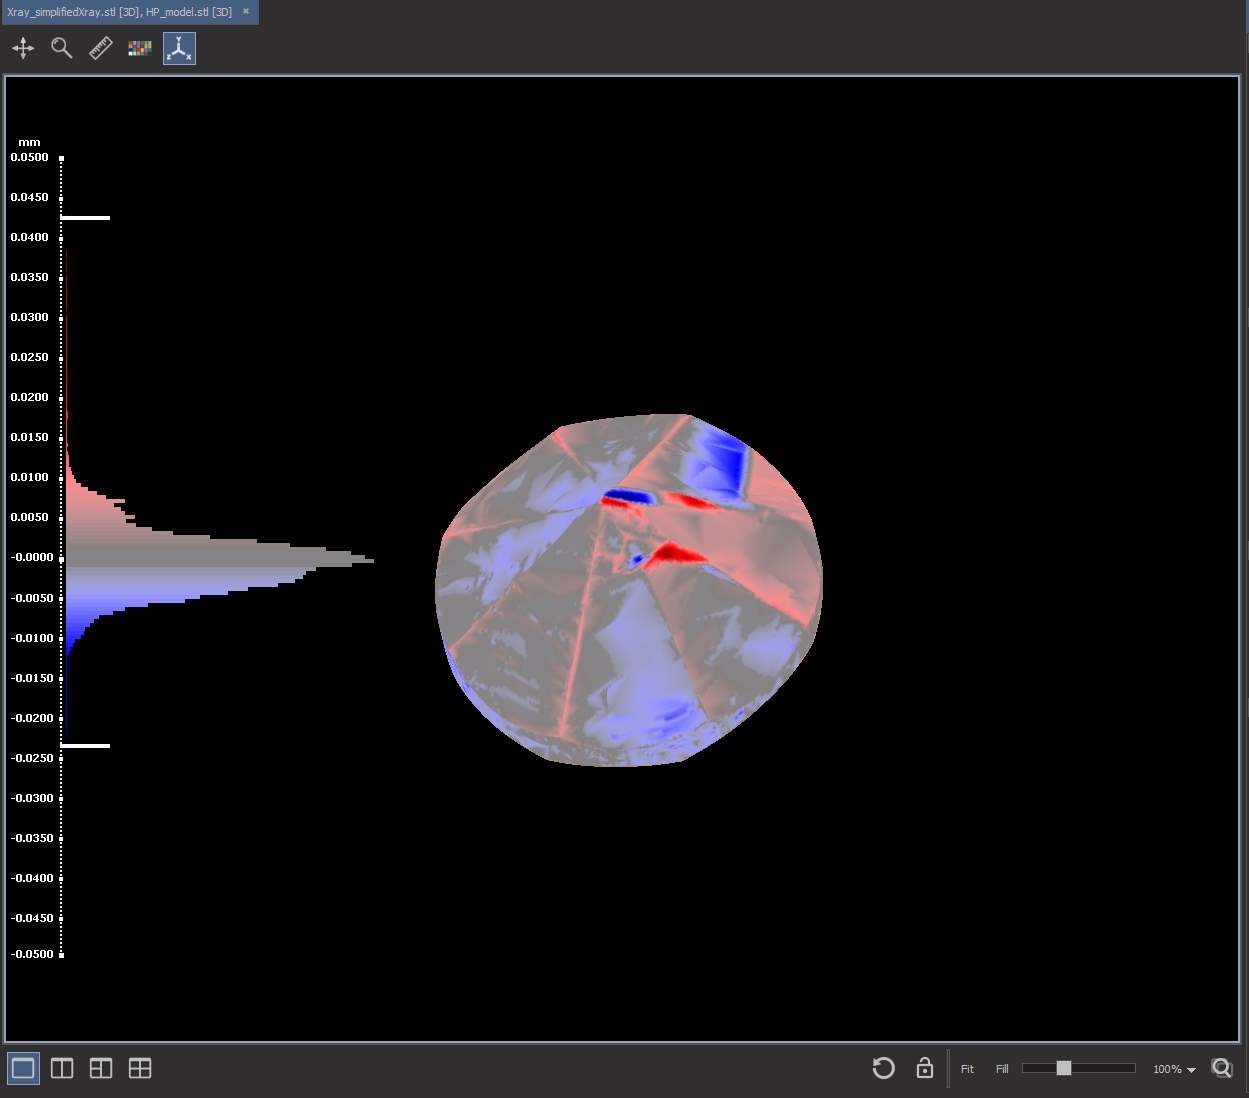
Figure 2. Central view of compared model with colored distance texture
In this window the comparison instrument displays measure scale and colour mesh. The comparison result is divergences (distances) at every vertex of the model. Unit of measure is millimetre. Every divergence value maps into the colour chart. On the Figure 2 you can see "Blue-Grey-Red" colour chart. For example, value 0.001 mm maps into grey colour, -0.025 mm into dark blue, 0.043 mm into dark red.
Management of colour settings
To choose alternative colour palette, select desired item from "Preset Ramps" list in "Quality map" section (see Figure 3).
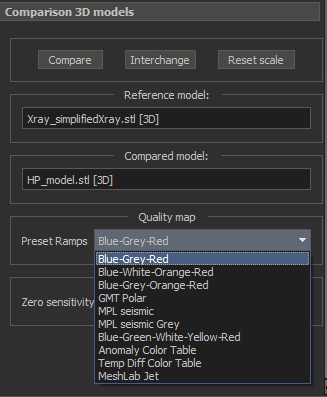
Figure 3. Colour chart preset selection.
Management of colour mapping
To ignore unimportant divergence (close to a zero) you can specify threshold in "Zero sensitivity" spin box (see Figure 4).
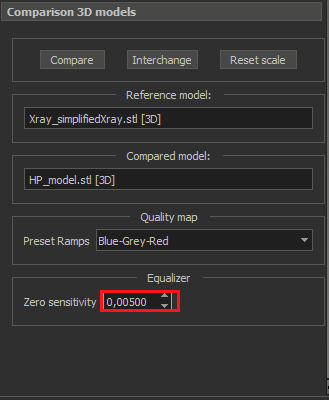
Figure 4. Setup unimportant distance range
For instance, you can see on Figure 5 comparison visualization in case zero sensitivity = 0.005 mm and "Blue-Grey-Red" colour chart.
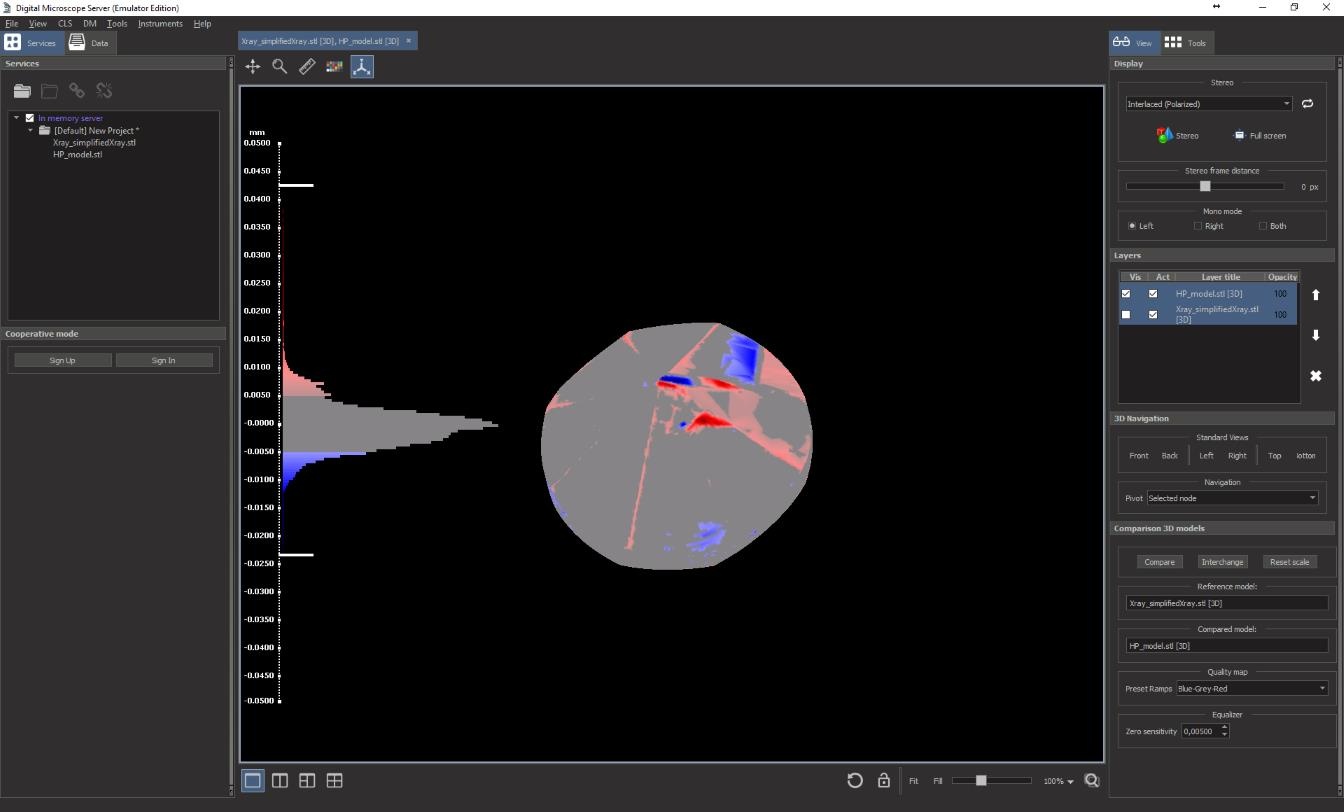
Figure 5 Example zero sensitivity set up to 0.005 mm
To emphasize difference for minimum or maximum distance you can change the distance scale with histogram. If you modify scale bounds colour mapping will be changed. By default the distance scale placed on the left part of view.
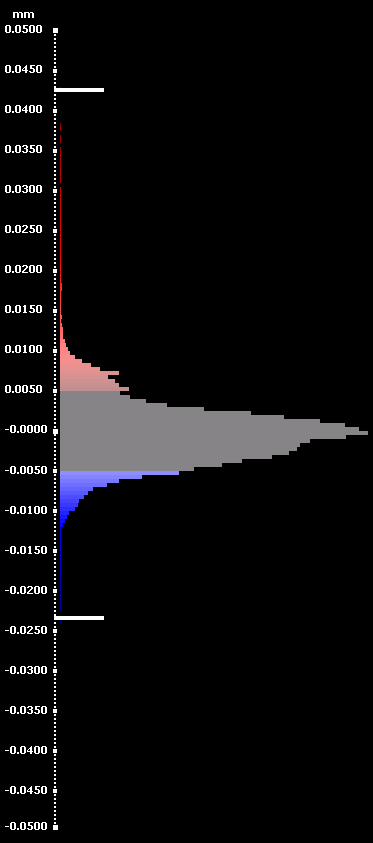
Figure 6 Distance scale with histogram
For example, to modify upper bound scale you should move mouse to white horizontal tick on the top of scale until the mouse cursor will be turned into  . Next press the left mouse button and drag white scale tick to desired distance value. After the left mouse button release colour mapping will be recalculated. Also if new both the bounds is decreased more than 2 times relative to the previous values the distance scale will be expanded (see example on Figure 7).
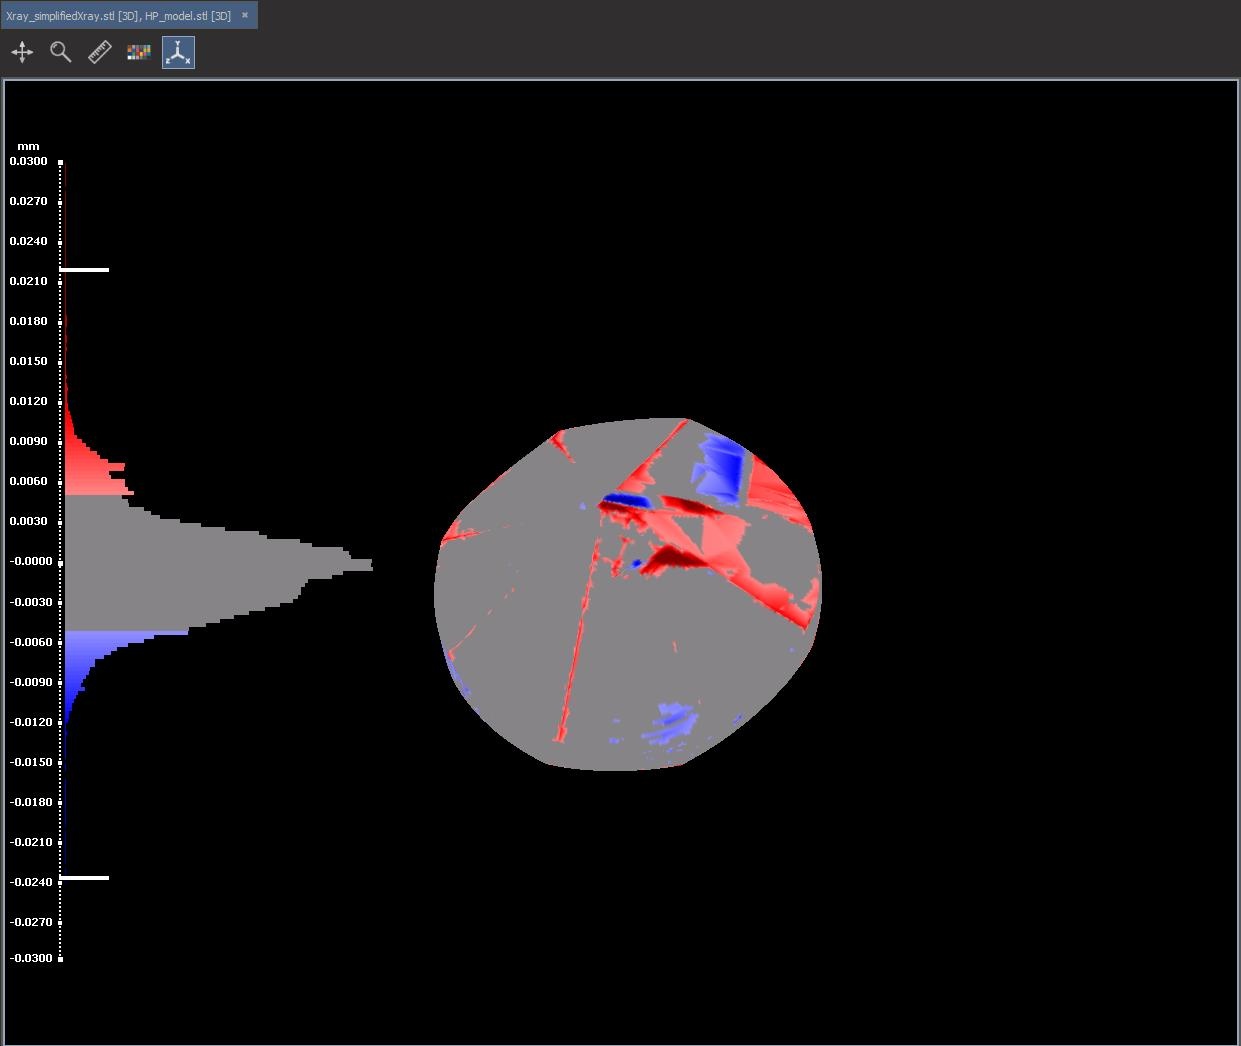
Figure 7 Expanded scale after upper bound decreasing
If you need to expand upper bound you should drag white tick to up. In case of low bound you should drag down tick. To restore origin scale bounds you can push the button "Reset scale" (see Figure 3). To simplify colour scale visualization you can use shortcut "Ctrl-Q". This shortcut switchs scale visualization between histogram mode and line palette.
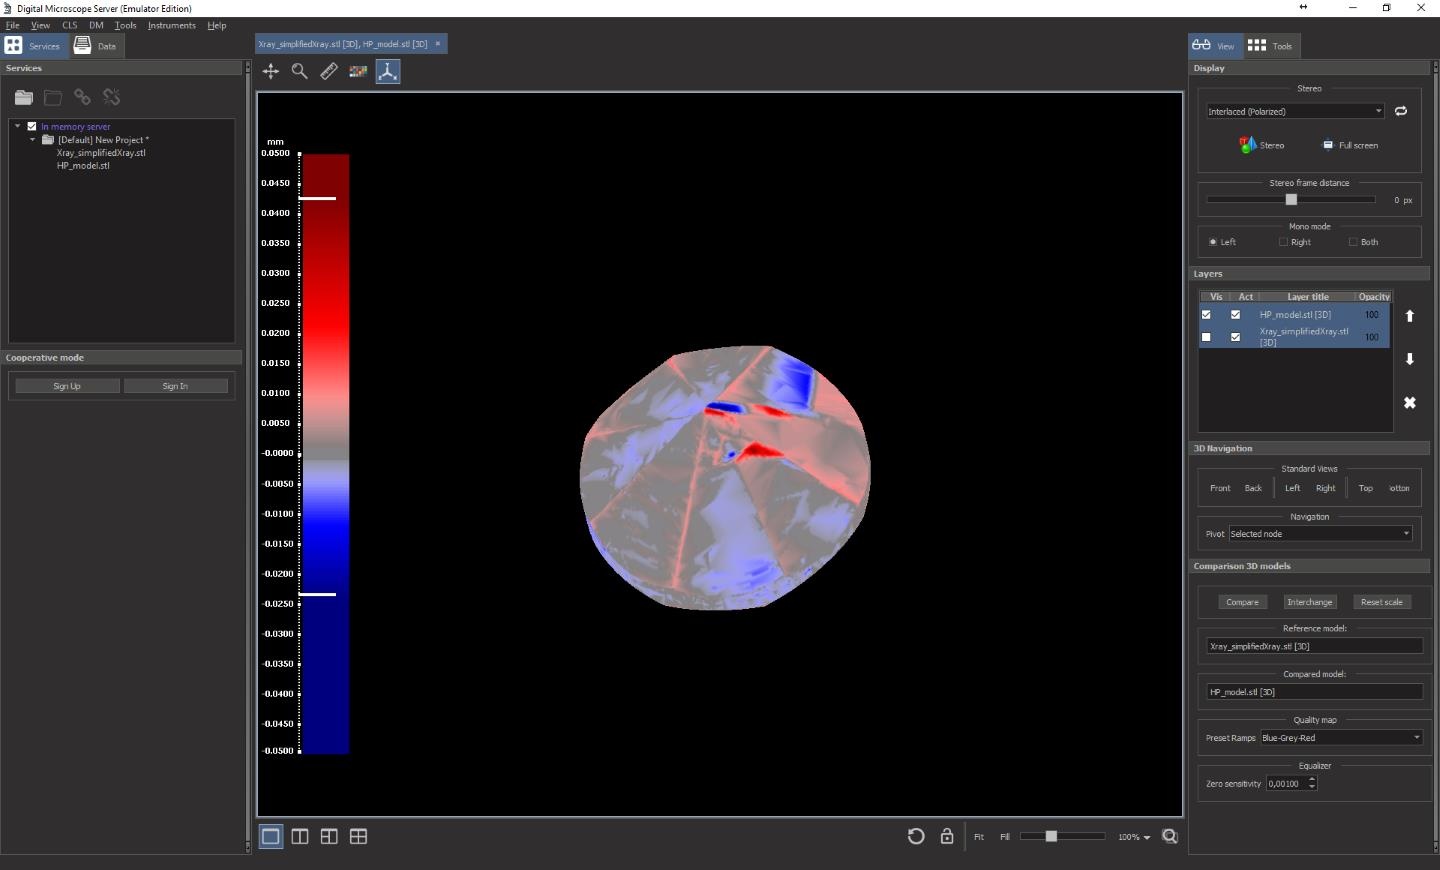
Figure 8 Line colour palette mode for distance scale
Additional features
You can use the next shortcuts and menus View→ Model Comparison:
| Shortcut | Short name | Description |
|---|---|---|
| Ctrl-L | Align Left | Align scale with histogram on the left part of view |
| Ctrl-R | Align Right | Align scale with histogram on the right part of view |
| Ctrl-T | Align Top | Align scale with histogram on the top part of view |
| Ctrl-B | Align Bottom | Align scale with histogram on the bottom part of view |
| Ctrl-Q | Change scale mode | Changing scale visualization between histogram and line palette |