Quick Intro
| Video | I3D - Interactive Report | ||||
| Published: | 2021, March 29 | Last Updated: | 2021, March 29 | v.1.4 |
| ||||
Video summary:
| ||||
Video keywords: configure, I3D, interact, interactive 3D report, print, view | ||||
| Published in: | Release Notes | |||
| Documentation | Interactive 3D Report, Data and Interaction in Interactive 3D Reports | |||
| Playlists | Short Videos | YouTube: HP Carbon | |||
| Also | As Separate Page | On YouTube | No Specification (Short Video) | |||
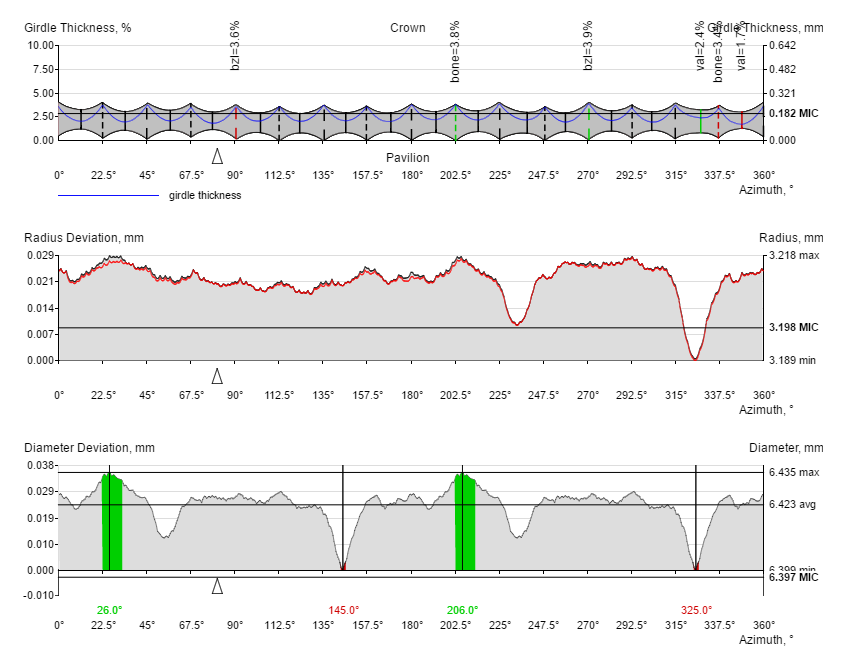
2D Girdle Plots
The following 2D plots are presented for Polish and Comparative reports:
- Girdle Thickness
- Radius Deviation
- Diameter Deviation
In the Comparative report, these plots are only available as plots for individual stones — Current and Reference (according to table mode selector).
Photorealistic Images and Optical Metric Images
When generating an I3D report in HPOxygen, you can choose to include Photorealistic images in the report.
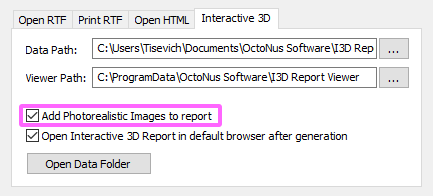
If the option is selected, a pre-defined set of images will be generated and included in the report document. Please note that Photorealistic image generation is a rather time-consuming procedure and enabling this option will add a few extra seconds to report generation time. This only concerns initial report generation in HPOxygen and does not significantly affect I3D Report document loading time.
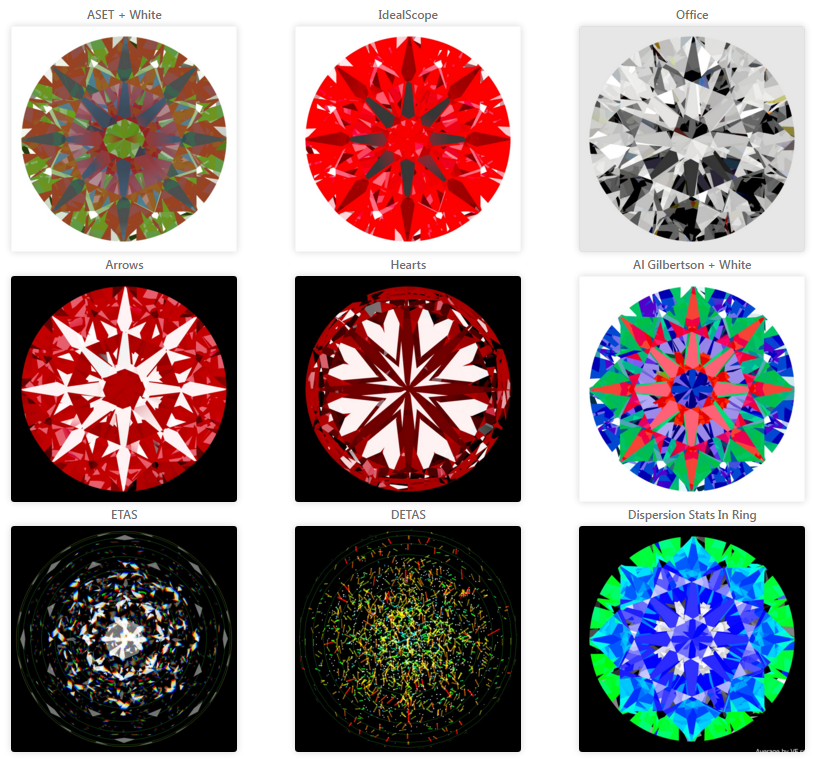
The following images are generated
- For Brillaints and Cushions:
| ASET + White | IdealScope | Office |
| Arrows | Hearts | Al Gilbertson + White |
| ETAS (small sphere) | DETAS | Dispersion Statistics Diagram in Ring |
- For other cuttings:
| ASET + White | IdealScope | Office |
| ETAS (small sphere) | DETAS | Dispersion Statistics Diagram in Ring |
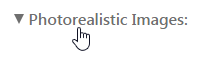
Please note that you can collapse the image block in the document by clicking on the block header:
Gallery Mode
You can also click on any image to enter Gallery mode. This allows you to see images in larger size and in better detail.
You can also use on-screen arrow links (pictured in the screenshot) or keyboard arrow keys (← and →) to quickly navigate between images in Gallery mode.
This is especially handy if you want to compare corresponding images of Current and Reference stones in Comparative report mode. You can simply open one of the images in Gallery mode and then use the keyboard arrow keys to switch back and forth between images of the two stones to clearly see the difference in patterns.
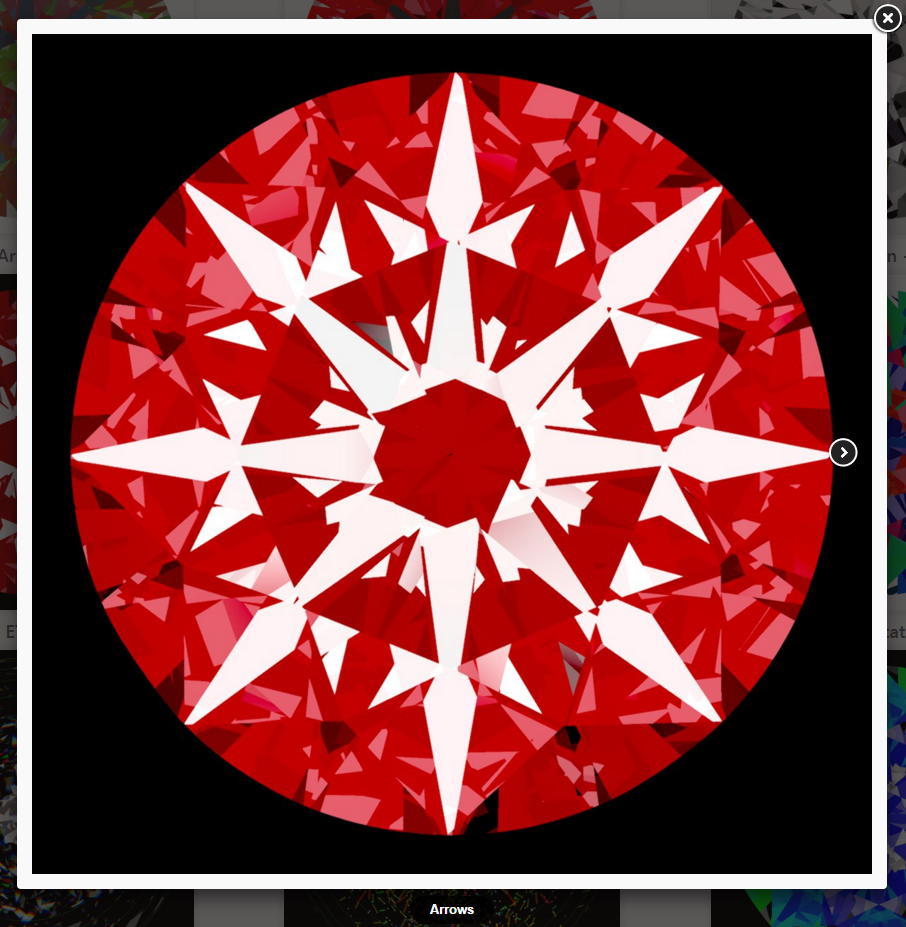
You can exit Gallery mode either by pressing the Escape key or by clicking on the "x" icon in the top right corner of the image.
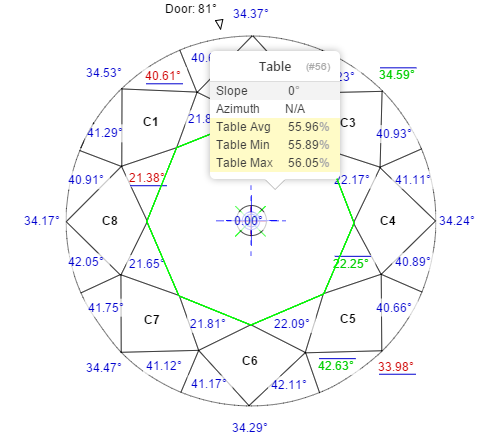
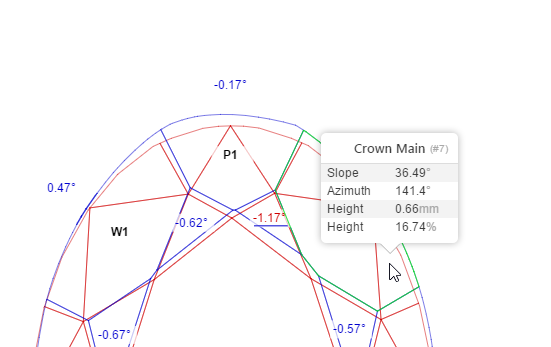
Facet-Specific Parameters in Tooltips
Facet-specific parameters are presented in tooltips displayed on the mouse over a facet.
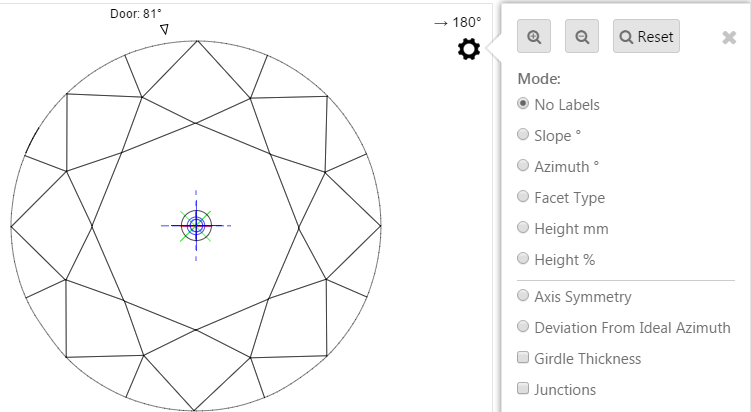
No Labels Mode
Sometimes it is better to have no textual labels over the model to make it easier to comprehend geometrical features and symmetry of the stone. The "No Labels" mode which hides main labels from the stone. Please note that additional labels (such as Junctions, Girdle Thickness markers, and others) are controlled by separate switches and are not affected by this mode:
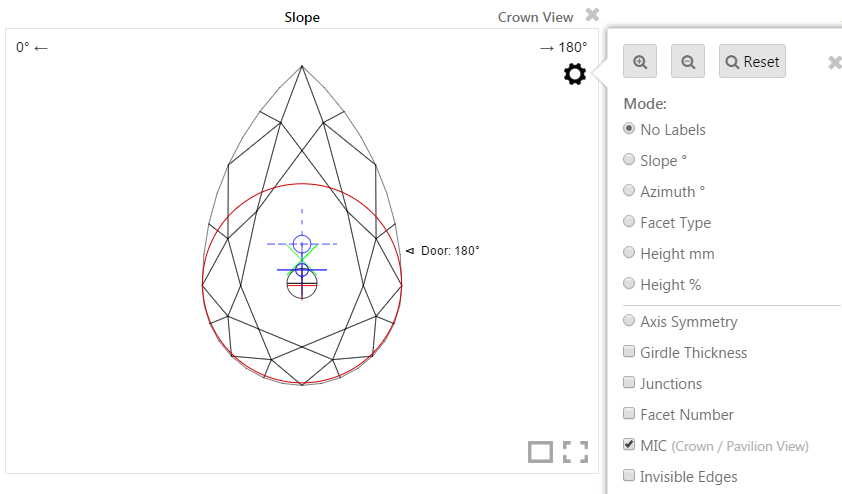
MIC Indication in Crown / Pavilion Views
In the Crown and Pavilion views, MIC indication is available. Any stone rotation, even insignificant, disables this feature until the stone is put back into one of the specified view positions.
MIC circle is drawn in red color:
Invisible Edges Without Refraction
Using the "Invisible Edges" option you can enable drawing of invisible model edges without refraction effects, which can help better judge model symmetry:
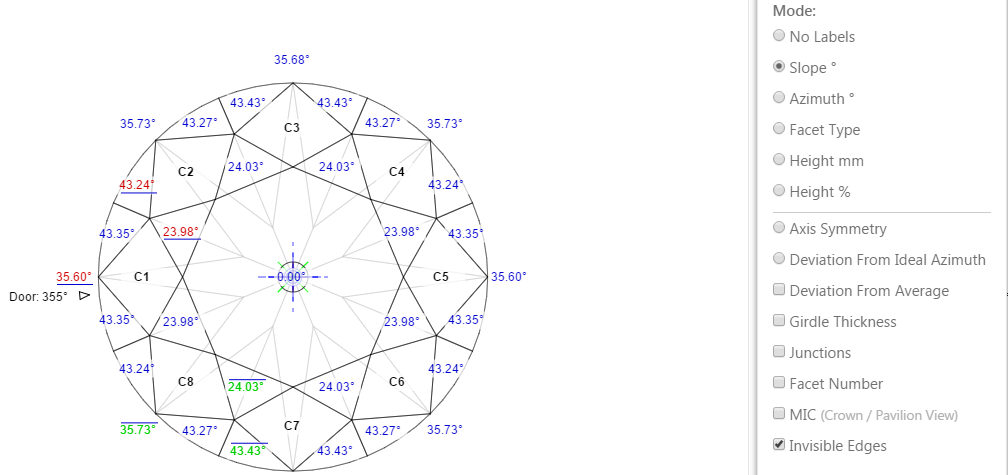
This mode is only available when one stone model is displayed (not two like in Comparative view).
Min / Max Girdle Thickness Markers Only
The new "Min / Max" setting only shows Min and Max values of Girdle Thickness:
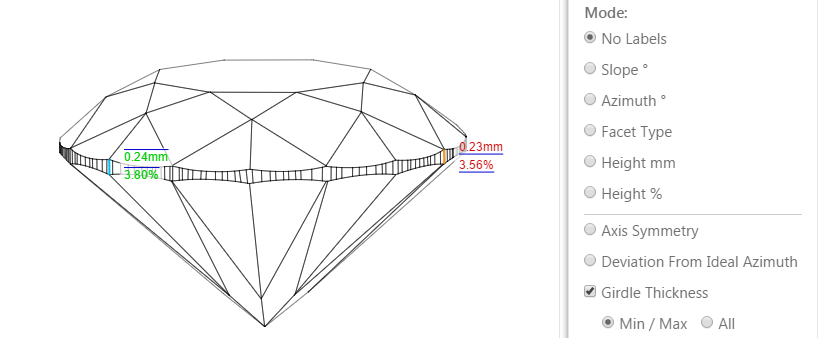
Please note that if there are numerous Girdle Thickness values equal to min or max value, all of them will be shown to avoid misunderstanding.
Thus, if you create a report for an ideally symmetric stone (solution), you will likely see no difference between these two modes, whereas on a real scanned stone the difference will be immediately observable.
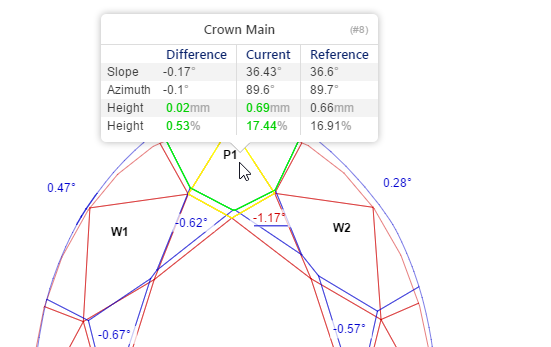
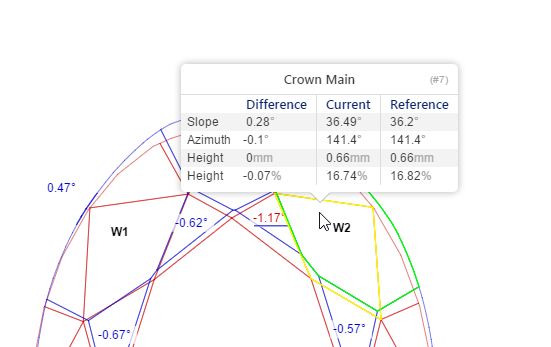
Comparative Difference Only for Paired Facets
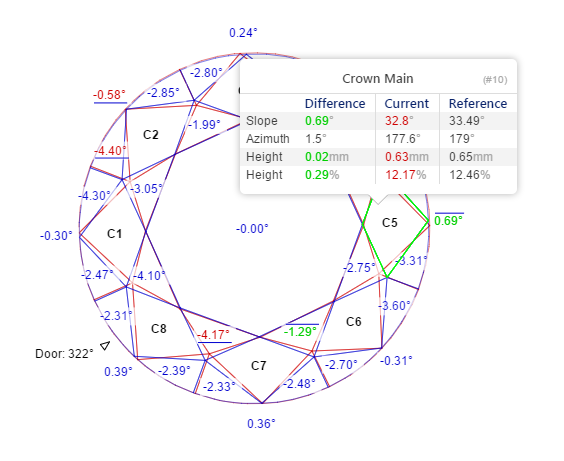
You will see Difference and Reference columns only when the mouse cursor hovers over both facets (Current and Reference) that were matched during report generation. In this case, both facets will be highlighted with special edge color:
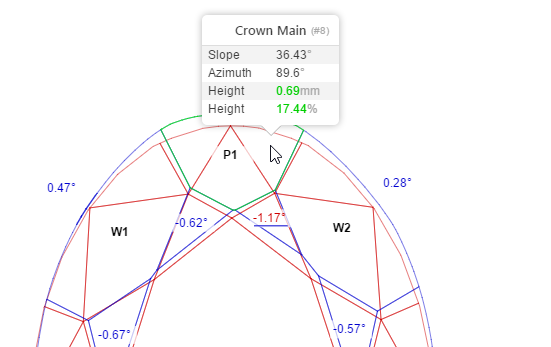
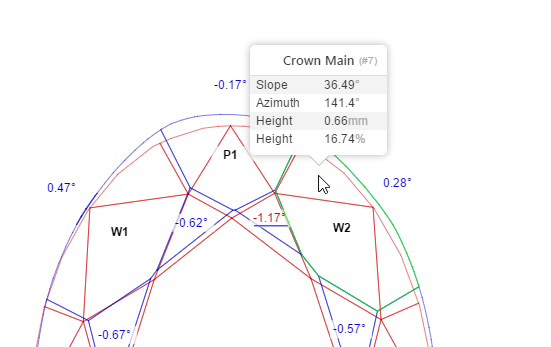
If you hover the cursor over two facets that were not matched, difference info will not be shown:
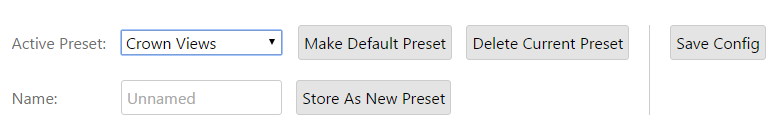
Grid Presets and Preset Manager
You can configure a selection of report Presets, which can automatically activate the specified number of 3D views with predefined settings.
You can also select specific Default Presets for both Polish and Comparative report. A Default Preset will be automatically activated whenever a new Report of the specified type is opened.
For detailed information on how to use the Preset Manager, please refer to the following document:
Configuring I3D Report Presets Using the Preset Manager
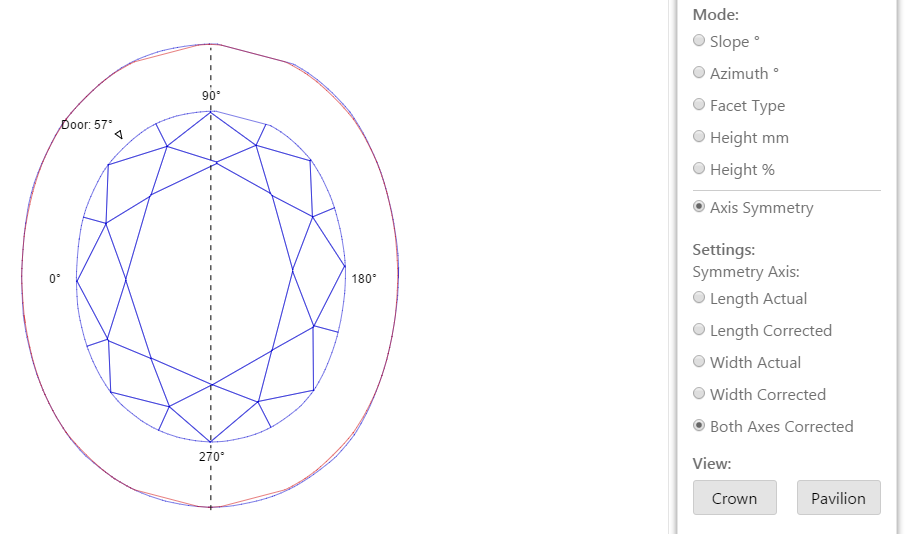
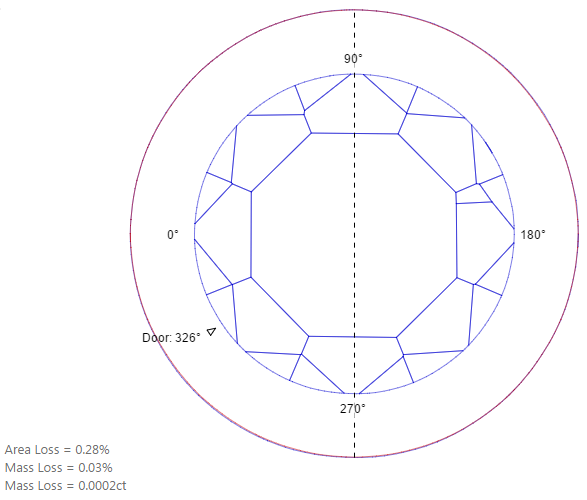
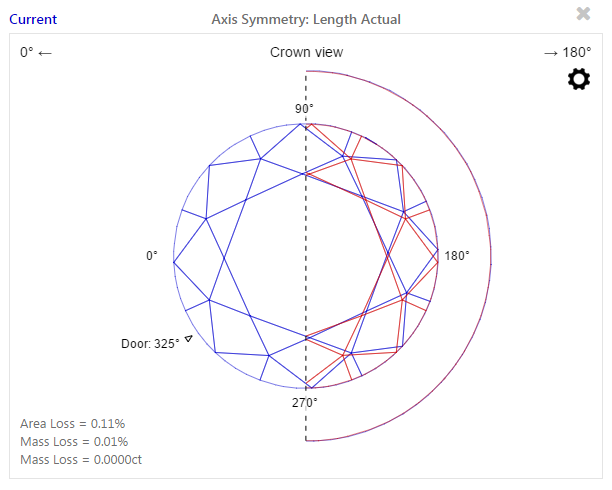
Both Axes Symmetry Mode
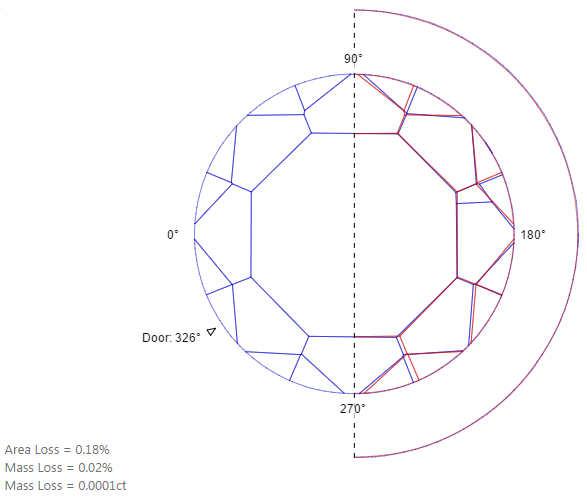
Area and Mass Loss indication in Axis Symmetry
Detailed View Description
The view description at the top now details which Symmetry mode is active, which model (Polish Current / Polish Reference) is displayed in the Comparative Report, and other relevant info:
Reference Stone Parameters in Comparative Report Facet Info Pop-up
Junctions
Use the Junctions option to enable junctions indication in any of the main modes:
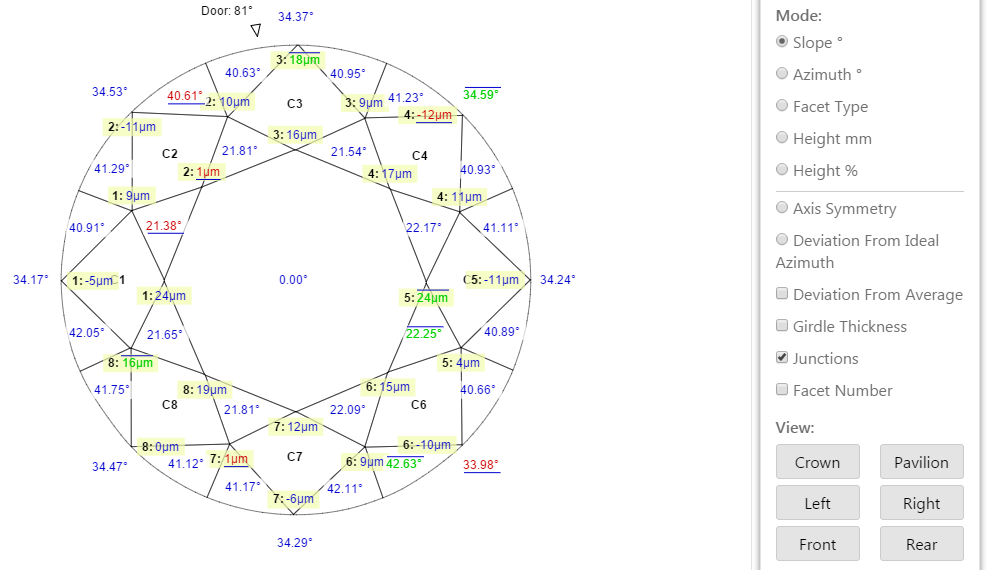
The format of the Junction labels is
| Junction Number: Junction Value, µm |
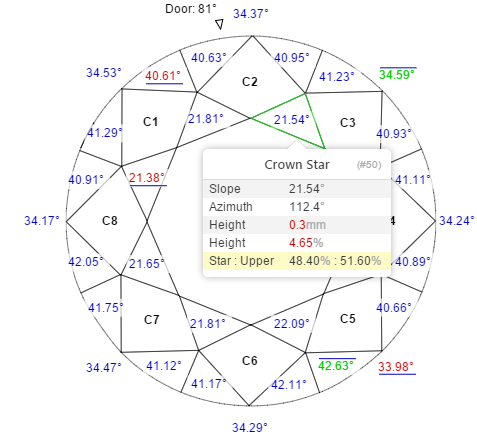
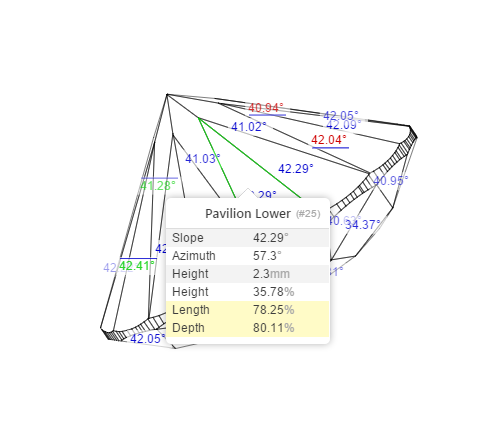
Facet Number
Facet number is indicated in pop-up facet description:
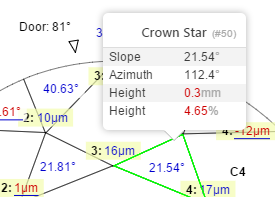
Here, we've selected facet #50. This can be used to precisely match facet in report and facet of the model in HPO software.
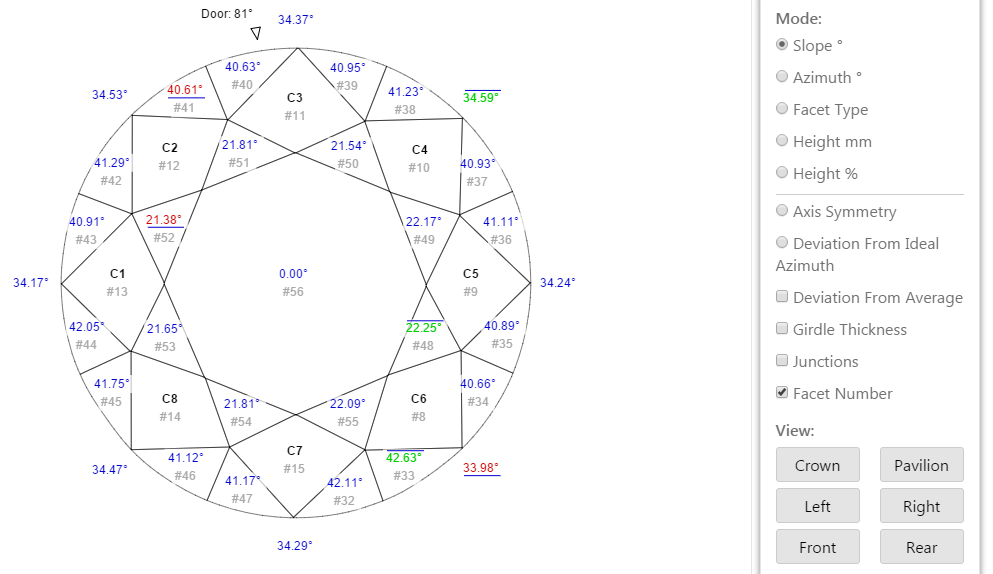
You can also enable the Facet Number option to permanently show facet numbers beside normal facet property labels:
Girdle Height / Thickness (Bezel, Bone, Valley)
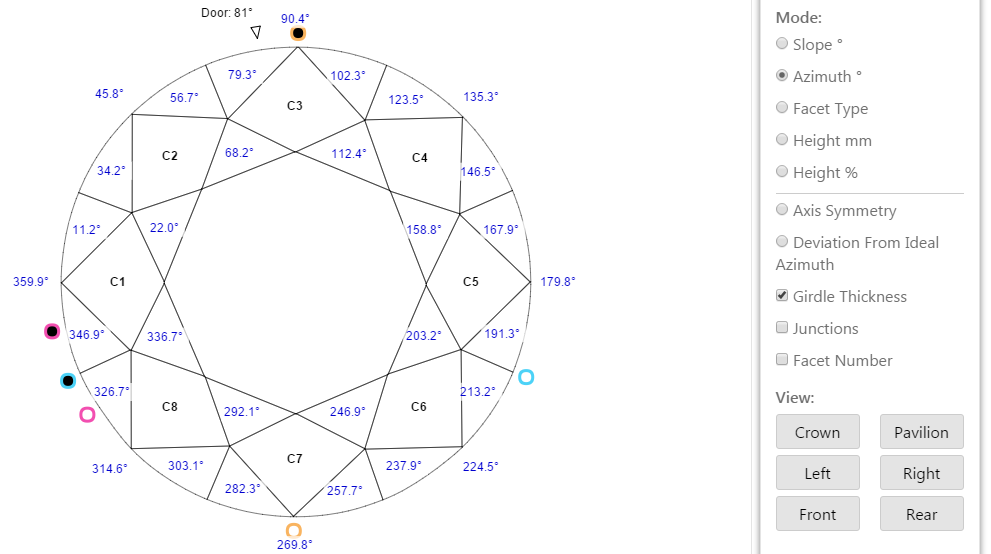
If the Girdle Thickness option is enabled, in Crown and Pavilion view you can see special markers, indicating positions of Minimum and Maximum Girdle Bezel, Bone and Valley measurements:
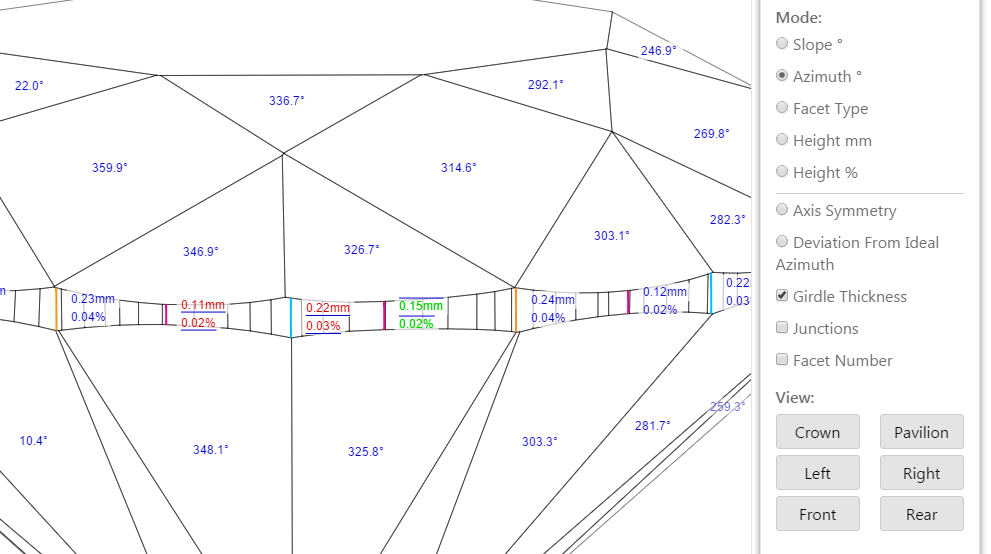
In side views, you can see detailed Girdle measurements in each point indicated with a corresponding color marker, including highlighting of Minimum and Maximum values:
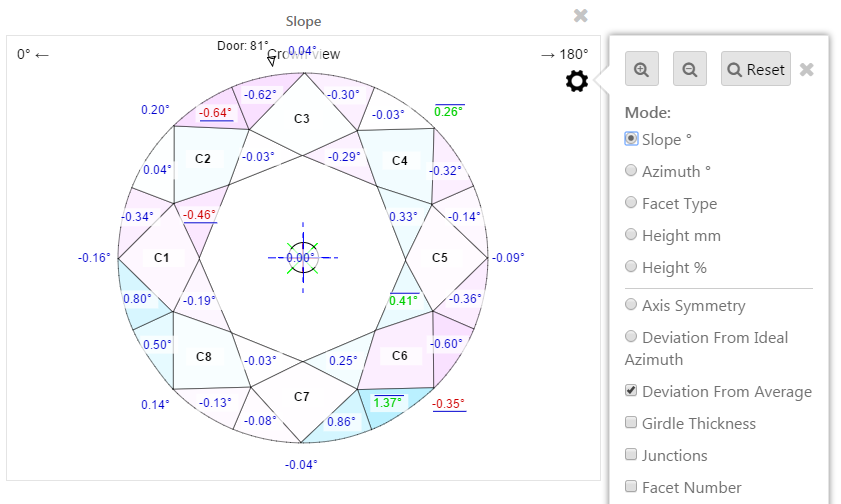
Deviation From Average
In Polish mode you can select the Deviation From Average option in the 3D Views for Slope or Height to enable color-coding of difference between properties of current facet an average values of the same property among the facet group.
I.e. you can see how the Slope of the specific Main or Star or Upper or any other facet differs from the average Slope of all the facets of the same type:
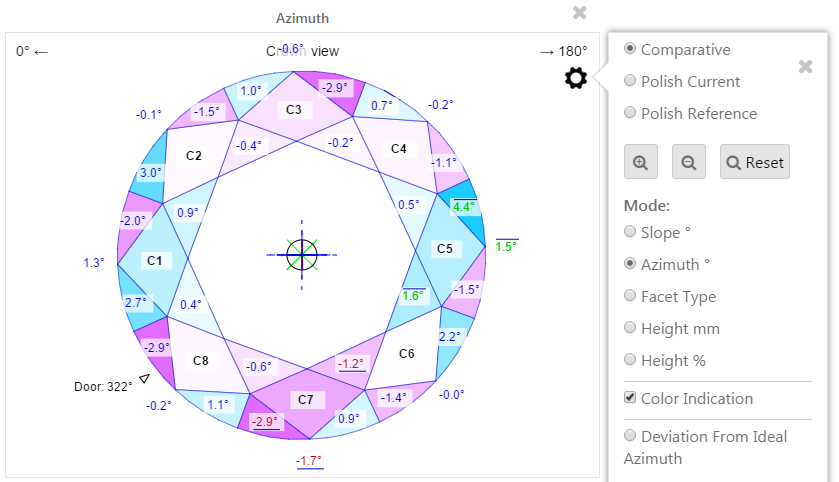
Color Indication of Values in Comparative Report
In Comparative mode you can select the Color Indication option in the 3D Views to enable color-coding of difference in selected parameter (Slope, Azimuth, Height):
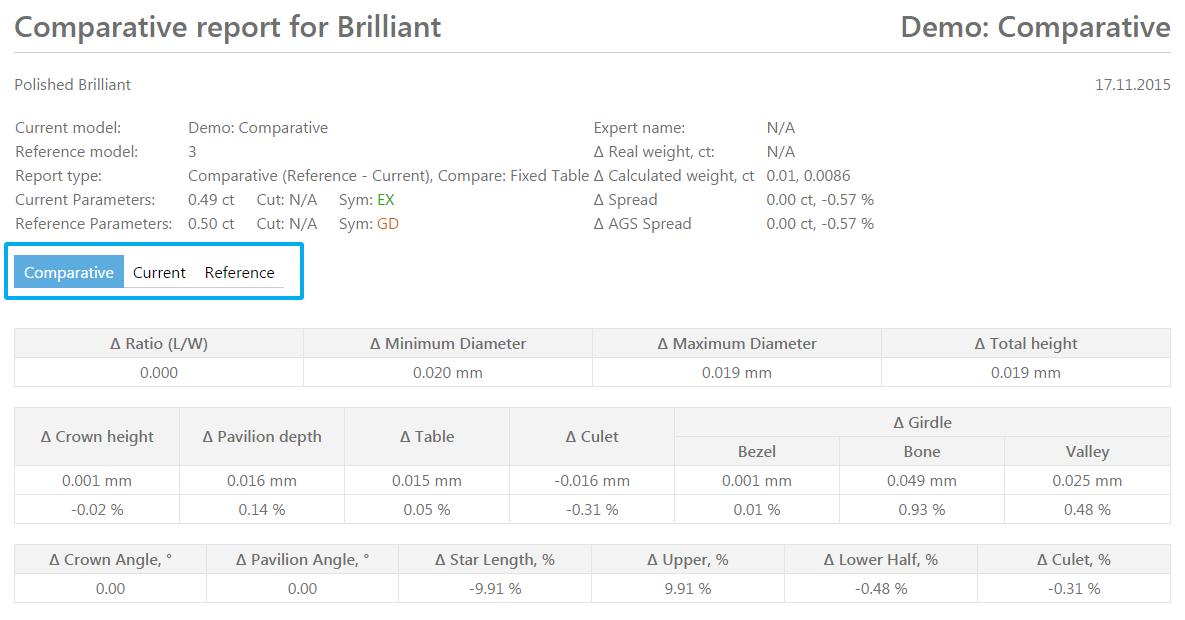
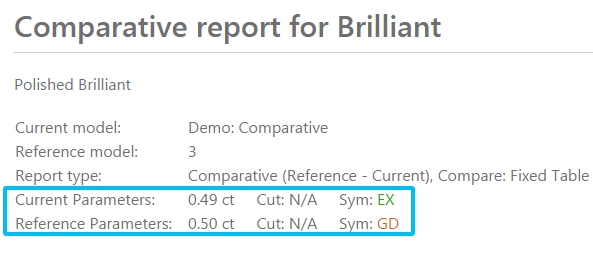
Polish Report Data for Current and Reference Stones in Comparative Report
In Comparative report you can switch between detailed data of Comparative Report, Current Polish Report and Reference Polish Report:
Use the highlighted selector to switch between report data modes:
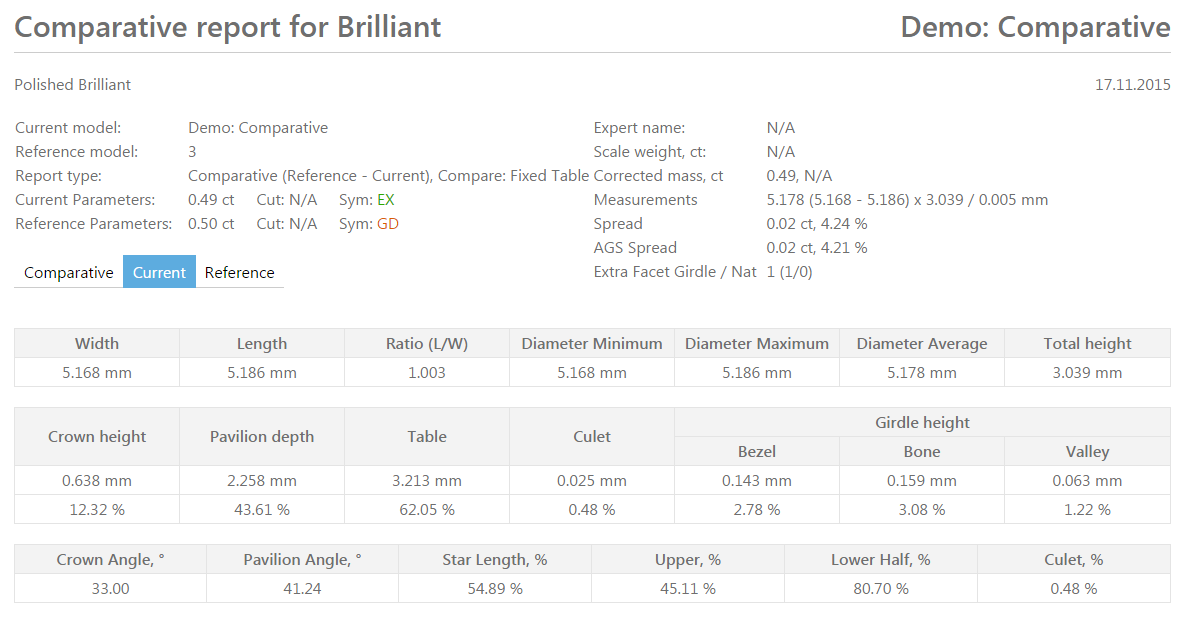
You can also see individual Polish stone parameters in Comparative report header data block:
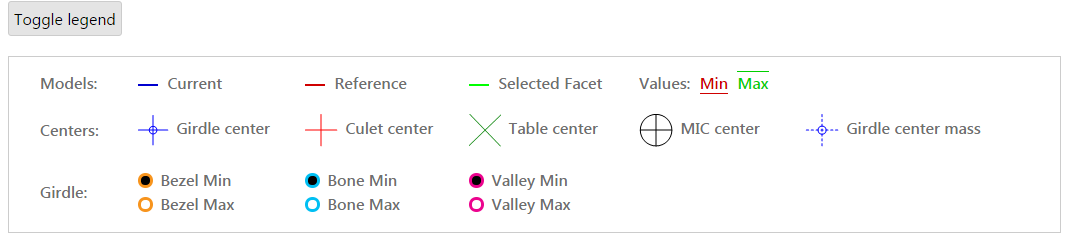
Detailed Legend
We've added more information to the Legend block:
Add Comment